Journal Metrics in Scopus: SCImago Journal Rank (SJR)
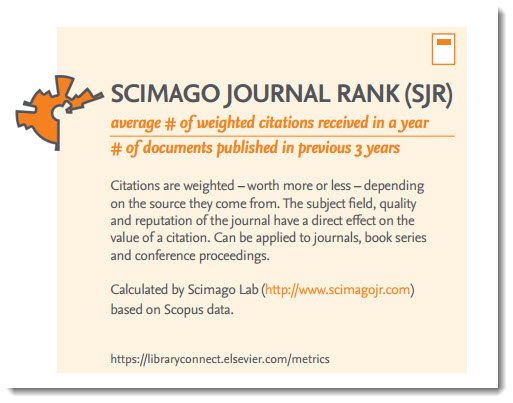
Recently, Library Connect worked with librarian Jenny Delasalle to create a set of quick reference cards on research impact metrics. Both a poster (11x17) sized version, which includes all the metrics on one page, and a larger format featuring 4 metrics cards per page, are available for download. Each card provides a quick summary of the metric — including how it’s calculated, what it measures and whether it applies to journals, authors or documents — and serves as a good jumping off point for further discussions around metrics. To add a bit more context regarding their specific relationship to Scopus, we will be looking at individual cards and providing the Scopus connection, starting with SCImago Journal Rank (SJR).
As stated in the card, SJR weights citations based on the source they come from.The subject field, quality and reputation of the journal have a direct effect on the value of a citation. SJR also normalizes for differences in citation behavior between subject fields. Further, SJR is calculated by SCImago Lab and developed from Scopus data.
SCImago is a research group from the Consejo Superior de Investigaciones Científicas (CSIC), University of Granada, Extremadura, Carlos III (Madrid) and Alcalá de Henares, dedicated to information analysis, representation and retrieval by means of visualization techniques.
How can you access and use SJR?
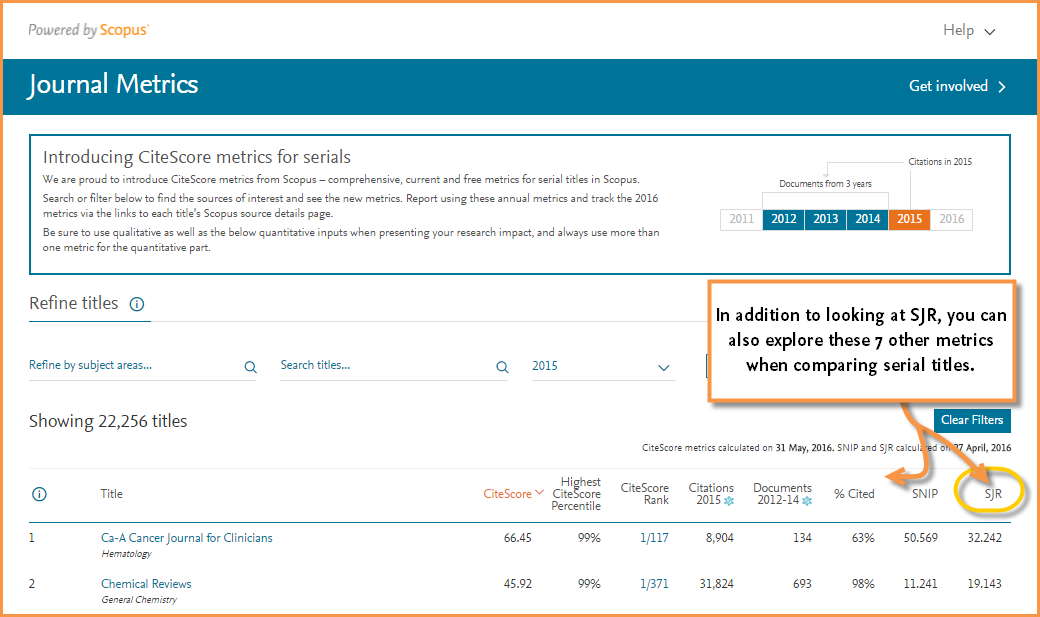
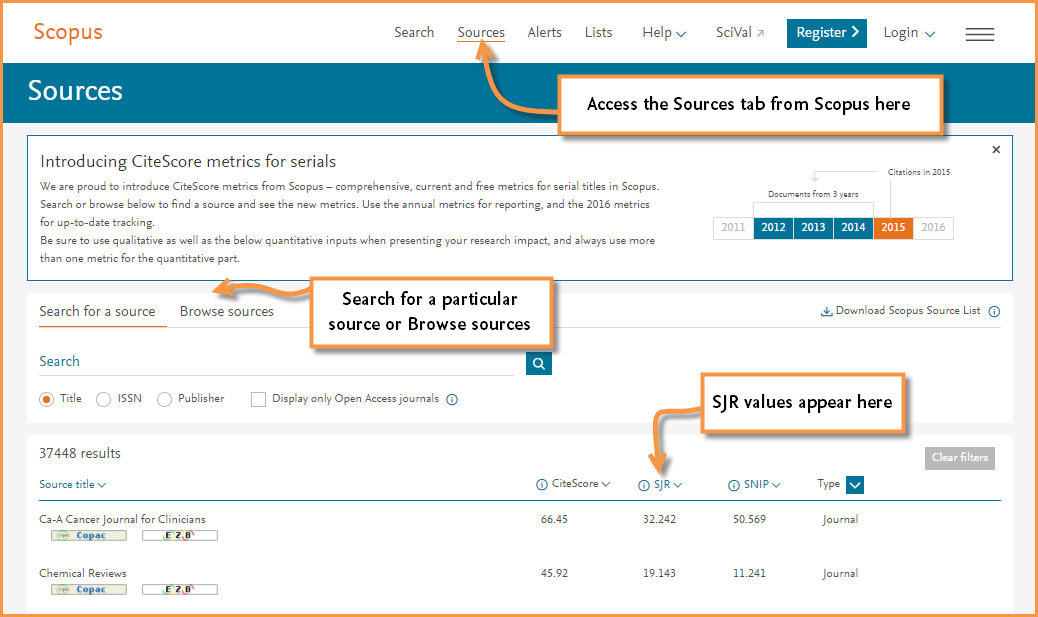
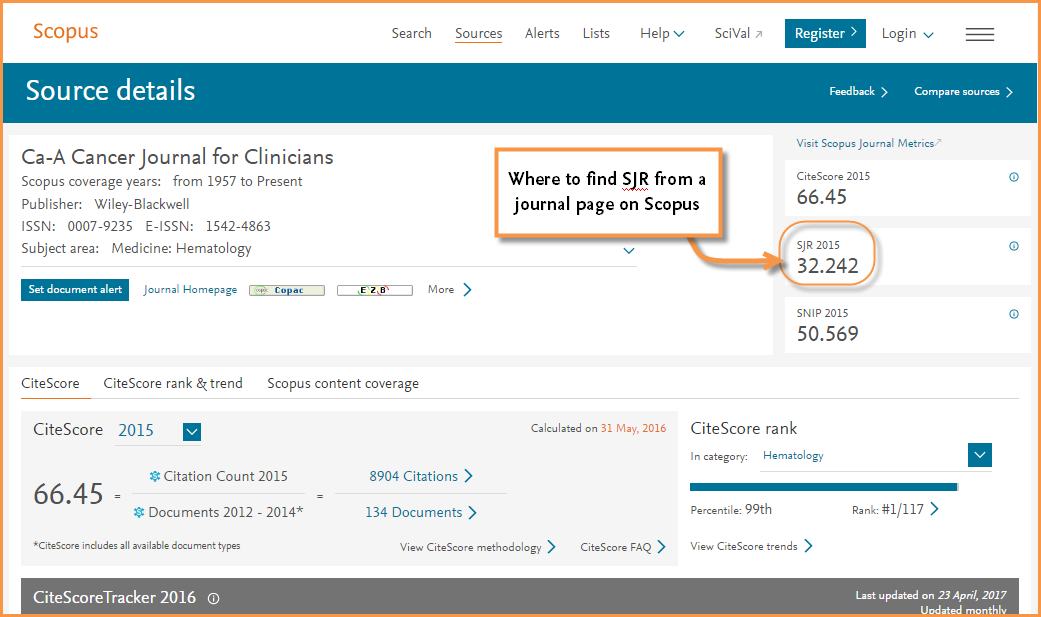
Here are 5 places powered by Scopus where you can find a title’s SJR calculation:
- The free JournalMetrics.Scopus.com website, which also allows you to compare multiple journals at one time and across other metrics
- The Sources page on Scopus, which is also freely accessible
- A journal title's homepage in Scopus
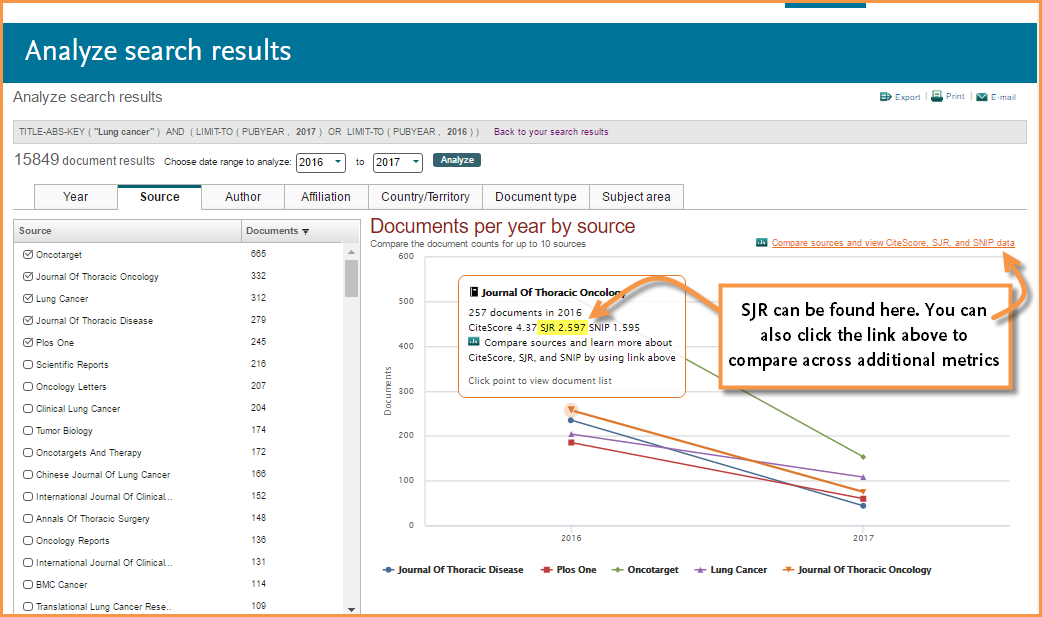
- From the <Source> tab when using the <Analyze search results> feature, and
- The <Compare journals> tool
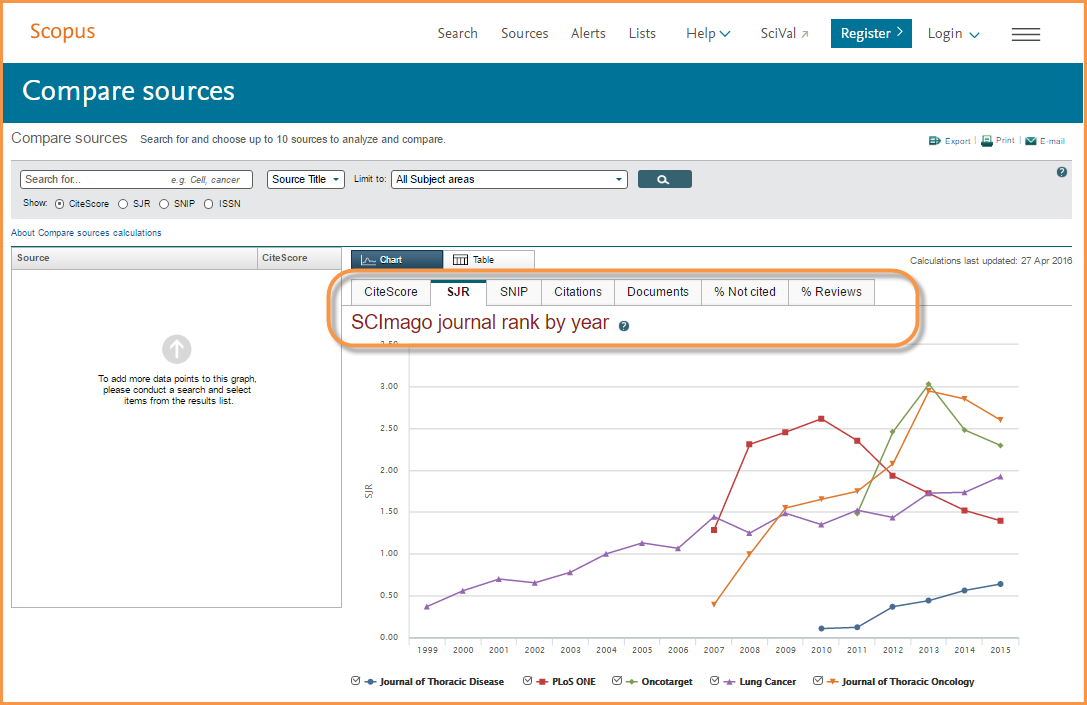
Let's look more closely at the <Compare journals> tool (watch the quick video clip below, note that this clip was made prior to recent updates to Scopus.com but the principle works the same). This tool allows you to gain a more complete analysis of the journal landscape. You can select up to 10 journals to upload into graphs for comparative analysis; and then compare the titles using a variety of metrics, including SJR. For example, if you are trying to identify the best and most prestigious journal to publish in, this tool offers helpful insights by allowing you to compare SJR calculations and trends for a set of journals at one time.
To further illustrate how this works, let's say you are looking for journals relating to Lung Cancer. Go to Scopus.com and:
- Click on <Compare journals>
- Search for “Lung Cancer” in the search box
- Select the journal titles you want to compare
- As you make your selections, the graphs will populate
From here, you can see the SJR values for your selected titles over time and compare the titles against each other. This graph can help answer questions like: ‘Is there a journal that seems to be on the rise?’ or ‘Is the journal with the highest value trending upward, maintaining or seem to be declining?’ The graphs give you a bit more visual insight into the measurements over time compared to a table or a singular value. You can even zoom in to look at a smaller window of time. NOTE: you can also compare the titles based on other metric values, such as SNIP (Source Normalized Impact per Paper) and CiteScore.
Additional places you you find SJR values outside of the Scopus platform and JournalMetrics.Scopus.com
SJR is a publicly available metric and can also be attained outside of the Scopus platform, here's where:
- Download the Scopus Source List from this page and find the SJR values from 2013 to 2015 listed in columns I, L and O
- Go to https://www.elsevier.com/solutions/scopus/features/metrics and click on the <Show more> button to access and download an archive of SJR values dating back to 1999.
- SCImago site: http://www.scimagojr.com/journalrank.php
Related resource:
You can learn more about <Browse sources>, <Analyze search results> and <Compare journals> in this webcast:


