How to discover key influencers and uncover trends from your Scopus search results
Scopus indexes over 120,000 book titles; and, by using the <Analyze search results> tool in Scopus in tandem with searching book content, you can gain a powerful way of discovering key influencers and uncovering important trends. To demonstrate how this works, watch our video or follow the steps below:
For this example, let’s say you are looking to find broad-based content and subject area experts on economic behavior. Note: click on each image to enlarge
- Begin a search in Scopus for Economic Behavior
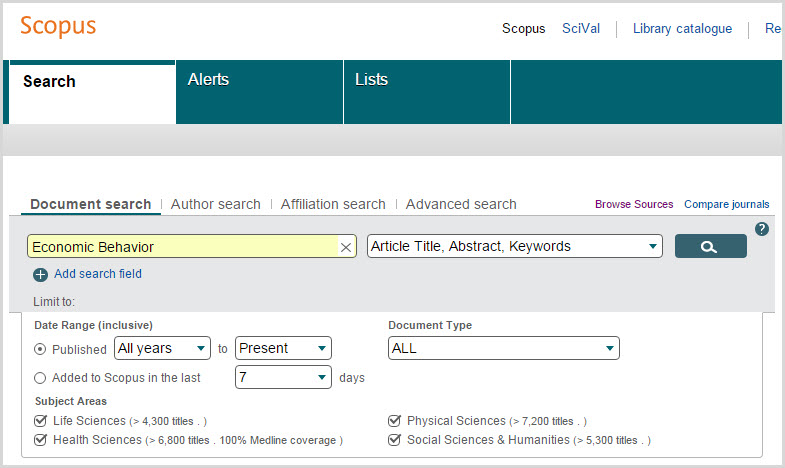
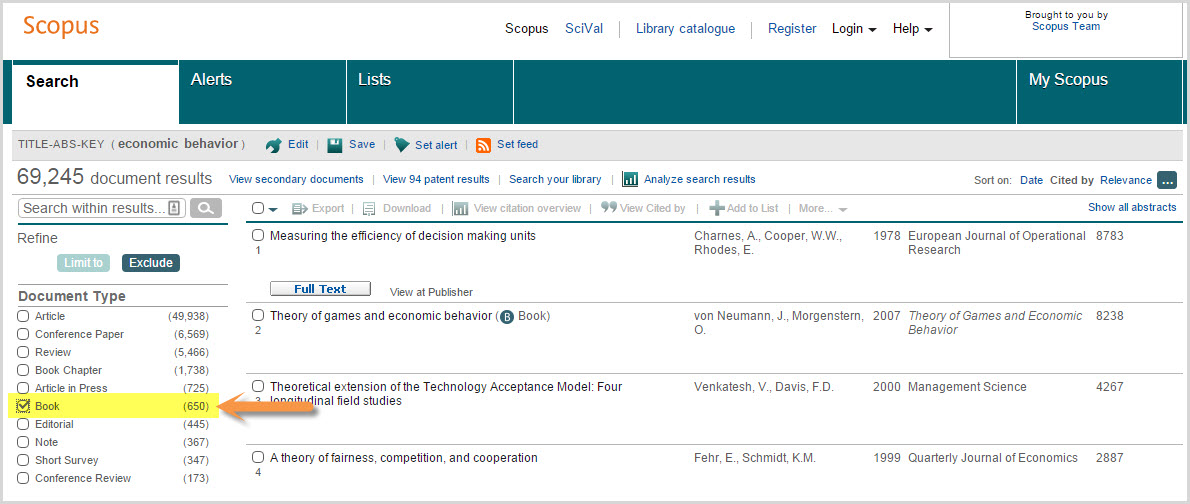
- The search returns over 69,000 document results. To make this a less intimidating number and isolate only book content, filter your results to <Books> on the left hand side, under the <Document type> parameter; and click on <Limit to>
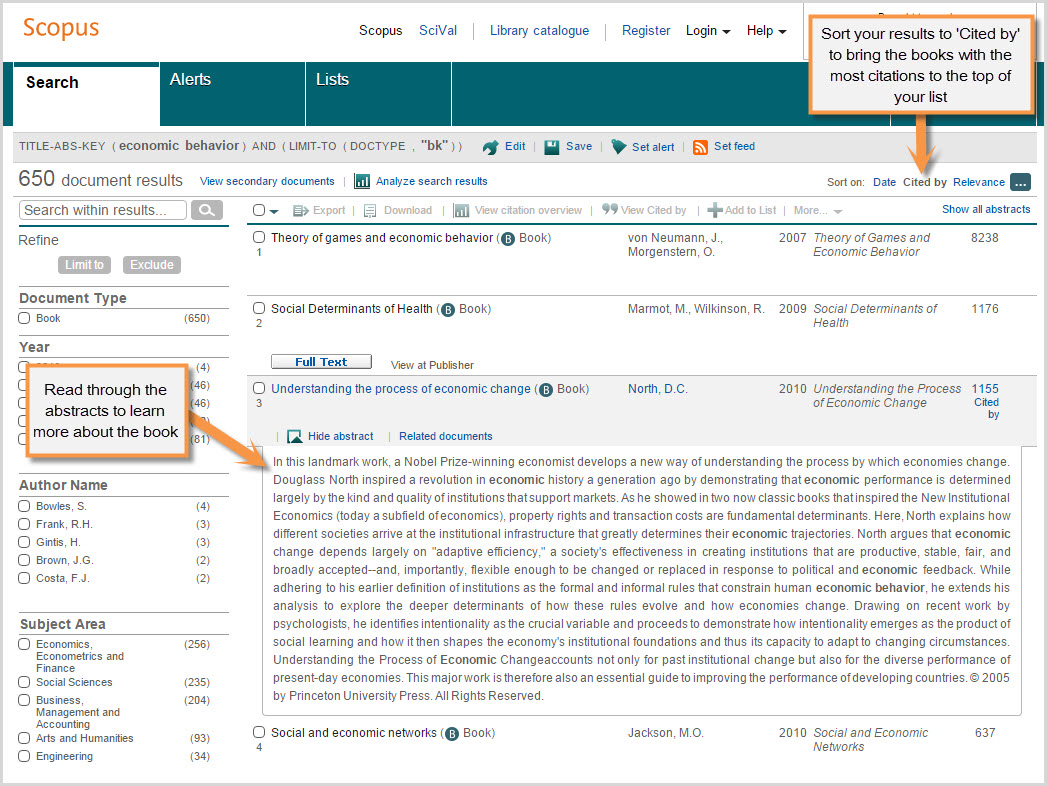
- Next, sort by <Cited by> to quickly identify the most impactful books
- Begin scrolling through the list and click on <Show abstract> to read more about a book and decide whether it is relevant to your research needs
- Once you isolate a book that both relevant to your research and well cited, click on the cited by number. This lists all content citing the book, including journal articles, books, conference papers, and more.
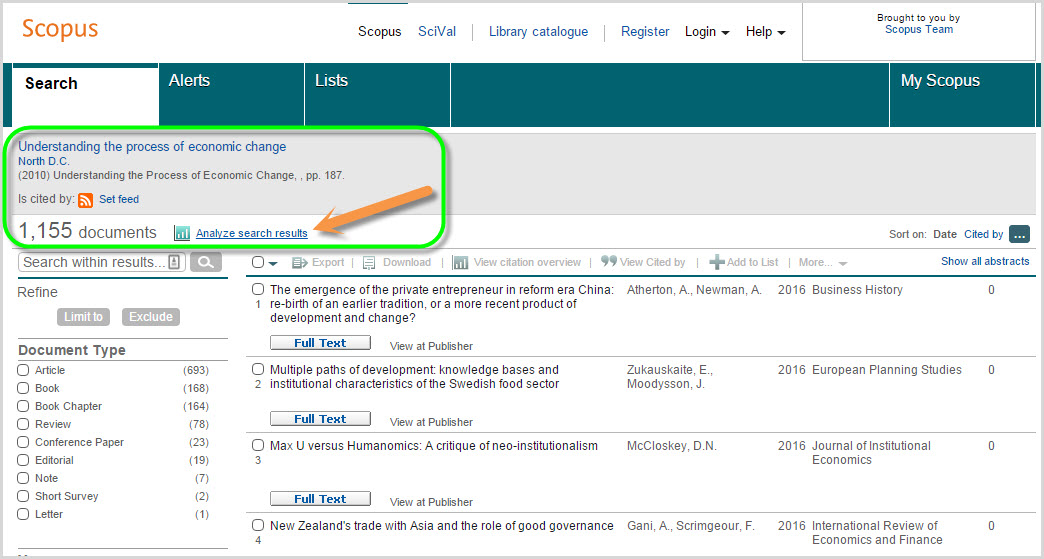
- However, before looking through this list and reading more abstracts, click on the <Analyze search results> tool to access a visual analysis of your results grouped into the following 7 categories:
- Year
- Source
- Author
- Affiliation
- Country/Territory
- Document type
- Subject area
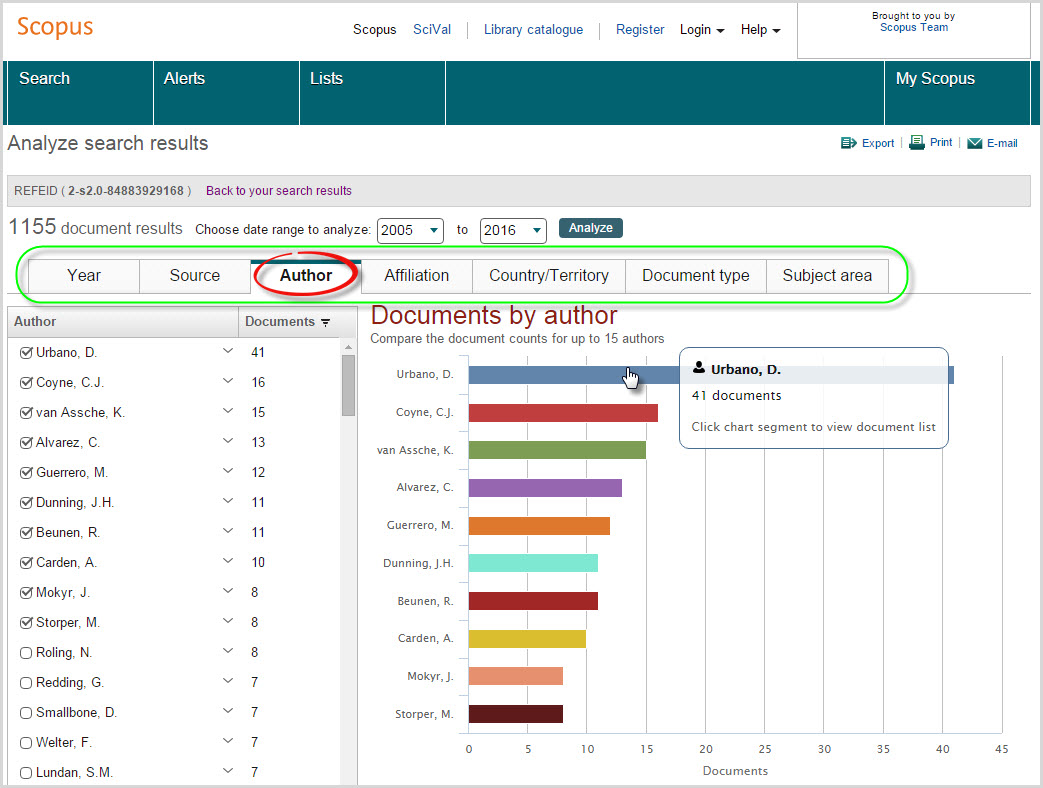
- Each grouping provides a unique and powerful way of understanding your results. For example, click on the <Author> tab to identify who is researching in this area, and what they are publishing. These might be people you want to follow, or possibly collaborate with. Or, click on <Sources> to find leading journals in your area of interest.
- As you browse through the charts, notice that you can also click on an author's name to further investigate their research impact; compare and analyze a group of journals in the <Sources> tab based on different metrics like SNIP or Impact per Paper; link to key historical content from the <Year> tab, and much more.
This is just one example of how to use the <Analyze results tool>, there numerous ways you can use it to help identify key research insights.
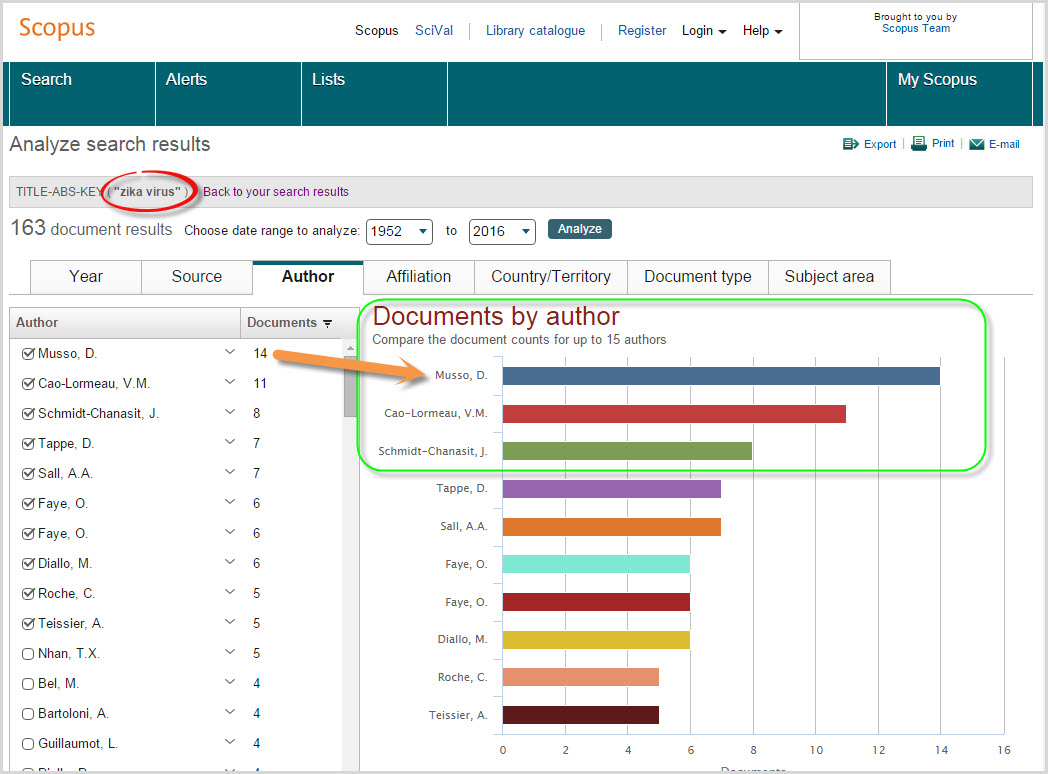
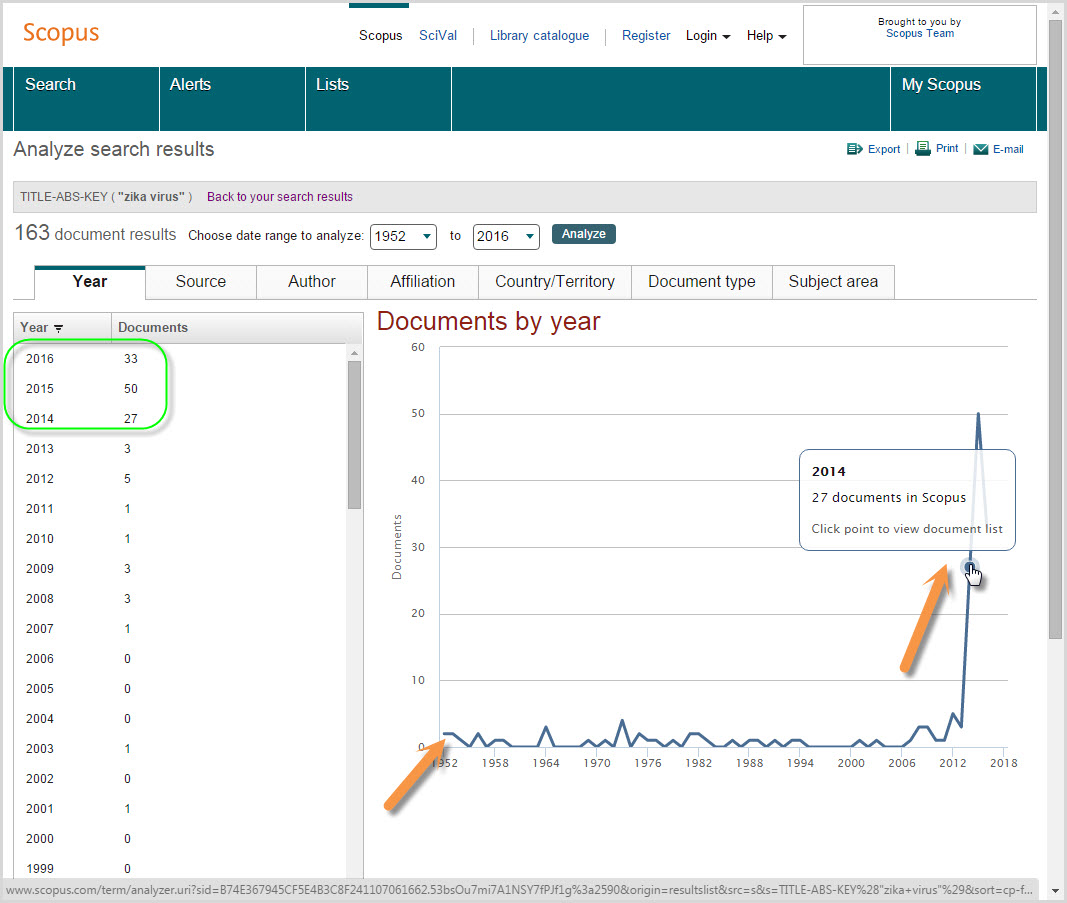
For example, the visual charts can also help you quickly analyze a current or trending topic like Zika virus. Here you might begin your search for “Zika virus” and then, rather than filtering by <Book>, click directly on the <Analyze search results> link from your search results and begin browsing the charts. Looking at the <Year> chart can provide important insights into the publication history and trending behavior of "Zika virus" research, and link you to important historical, recent and developing research; and, the <Author>’ tab can help you assess who is leading the "Zika virus" research effort.
"Zika virus" search results analyzed by <Year>
"Zika virus" search results analyzed by <Author>