Journal Metrics in Scopus: Source Normalized Impact per Paper (SNIP)
In a previous post we began looking at some of the metrics featured in Library Connect’s Quick Reference Cards for Research Impact Metrics and sharing how they relate to Scopus. The first post covered SCImago Journal Rank (SJR). Continuing on with the journal metrics theme, in this post we discuss Source Normalized Impact per Paper (SNIP).
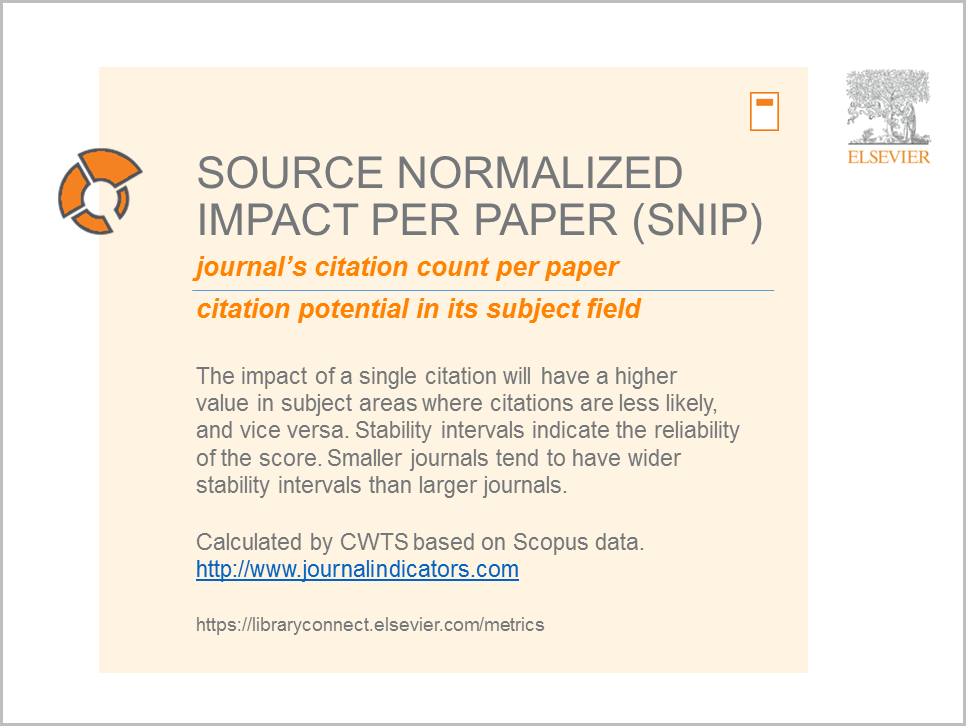
SNIP was created by Professor Henk Moed at the Centre for Science and Technology Studies (CTWS), University of Leiden. It measures contextual citation impact by weighting citations based on the total number of citations in a subject field, using Scopus data.
Or, as stated by the CTWS, “SNIP corrects for differences in citation practices between scientific fields, thereby allowing for more accurate between-field comparisons of citation impact.” (http://www.journalindicators.com/)
As shared in the quick reference card displayed, SNIP is derived by taking a journal’s citation count per paper and dividing it by the citation potential in its subject field.
How to access and use SNIP
Here are 5 places, powered by Scopus, where you can find a title’s SNIP calculation:
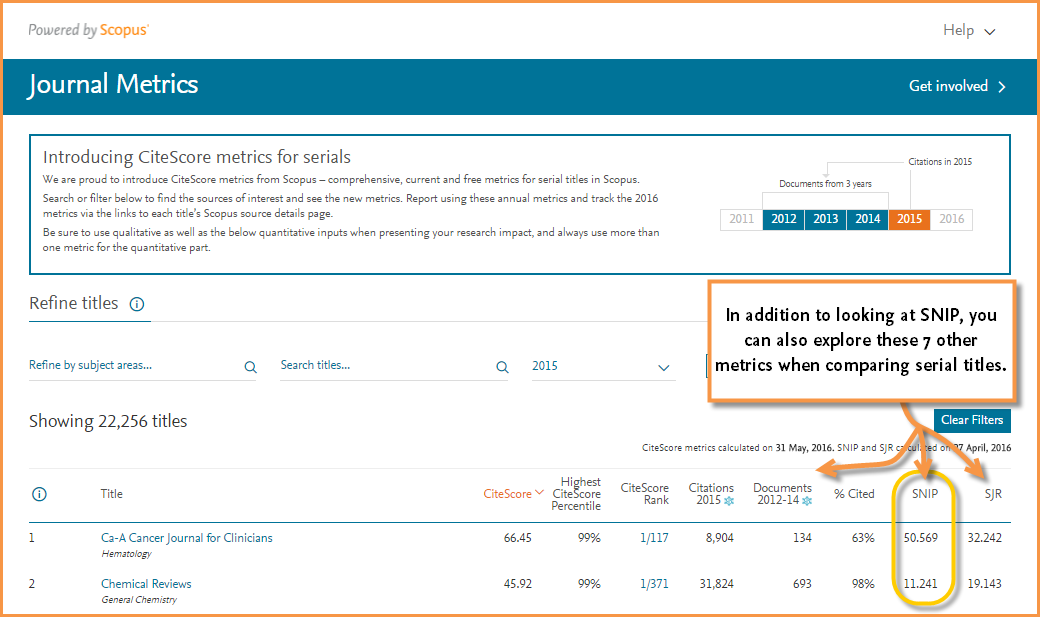
- The free JournalMetrics.Scopus.com website, which also allows you to compare multiple journals at one time and across other metrics
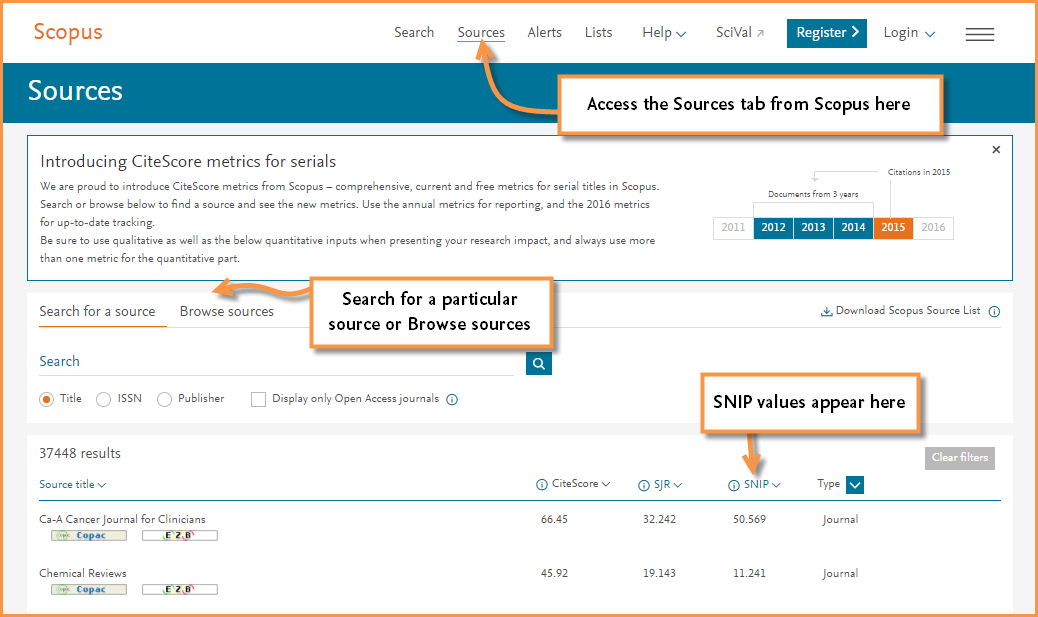
- The Sources page on Scopus, which is also freely accessible
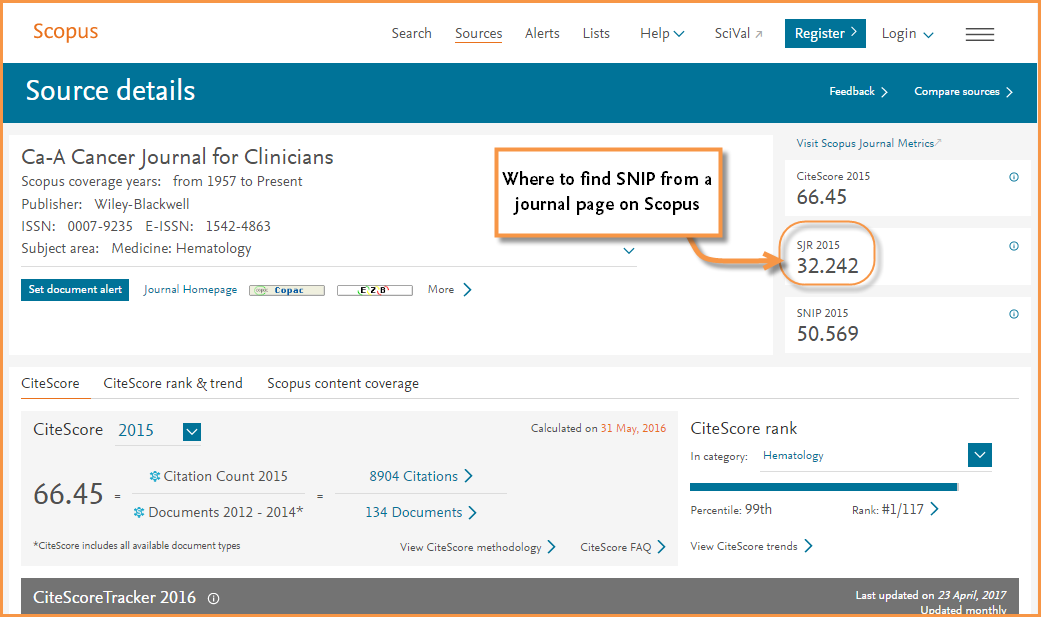
- A journal title's homepage in Scopus
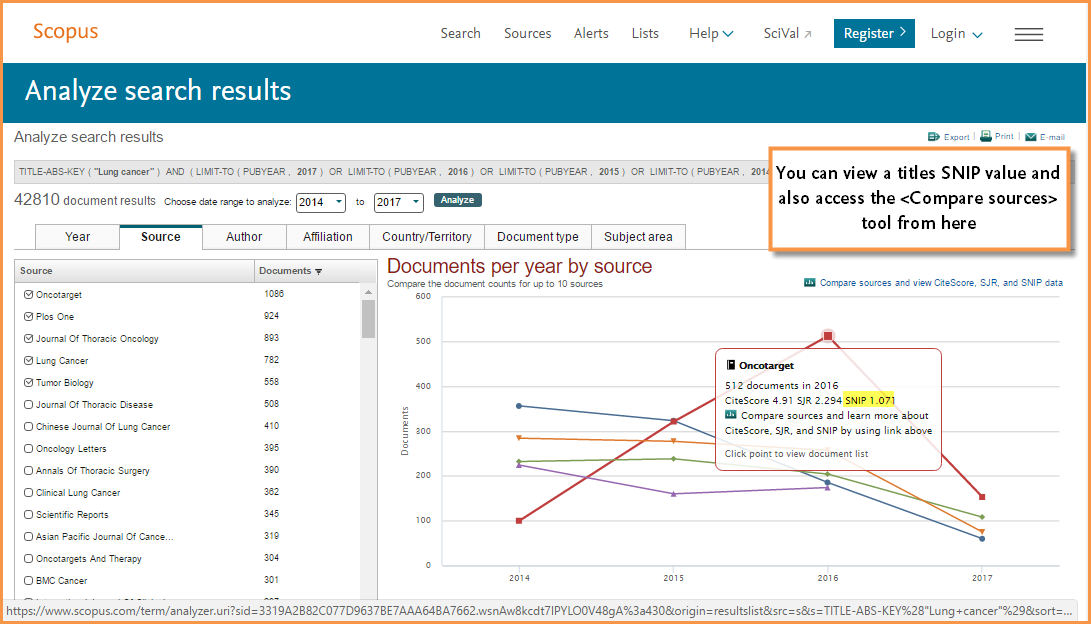
- From the <Source> tab when using the <Analyze search results> feature, and
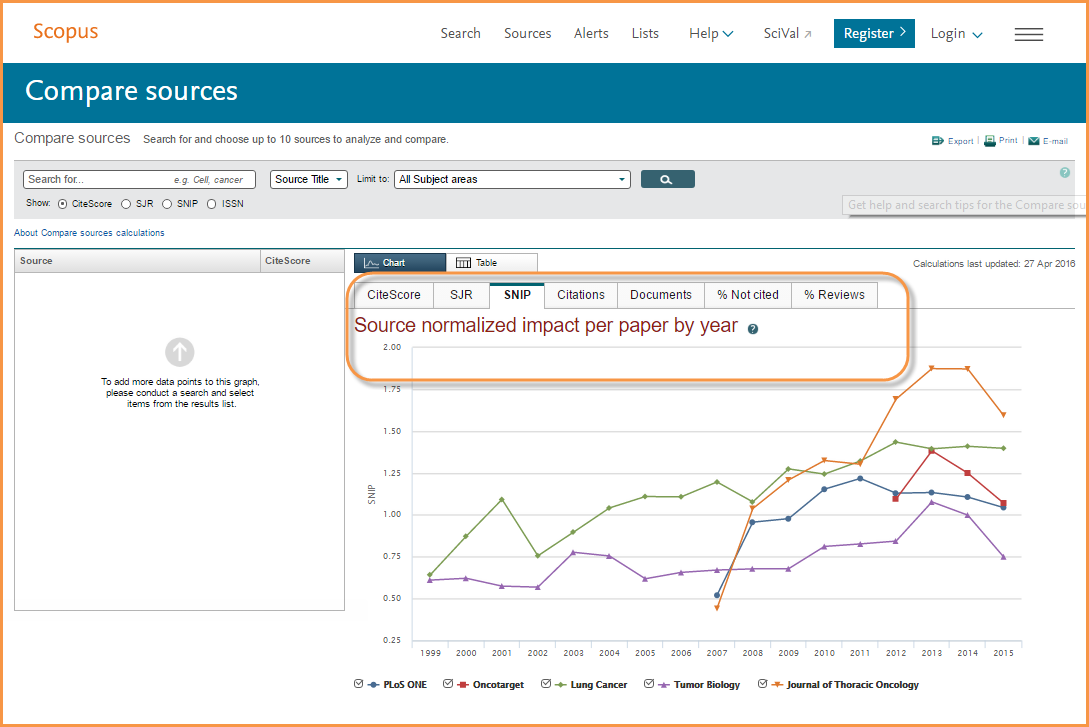
- The <Compare journals> tool
Let's look more closely at the <Compare journals> tool (watch this quick video clip. It shows SJR, but the principle works the same for SNIP). This tool allows you to gain a more complete analysis of the journal landscape. You can select up to 10 journals to upload into graphs for comparative analysis; and then compare the titles using a variety of metrics, including SNIP. For example, if you want to compare journals from different subject areas, this tool offers helpful insights by allowing you to compare SNIP calculations and trends for a set of journals at one time.
To further illustrate how this works, let's say you are looking for journals relating to “Conservation.” Go to Scopus.com and:
- Click on <Compare journals>
- Search for “conservation” in the search box
- Select the journal titles you want to compare
For this example we've selected:
- Conservation and Society
- Science for Conservation
- Studies in Conservation
- Resources, Conservation and Recycling, and
- Biodiversity and Conservation
- As you make your selections, the graphs will populate
From here, you can see the SNIP values for your selected titles over time and compare the titles against each other. When you compare the SNIP graph to the Citations or SJR graphs, you begin to see different trends. These trends correspond to normalized values, which is particularly helpful when looking at a set of titles with varying subject areas. Each graph in the <Compare journals> tool gives you a bit more visual insight into the measurements over time compared to a table or a singular value. You can even zoom in to look at a smaller window of time.
Where can you find SNIP values outside of the Scopus platform?
SNIP is a publicly available metric and can also be attained outside of the Scopus platform. Here's how you can access SNIP values from outside of Scopus.com:
- Download the Scopus Source List from this page and find the SNIP values from 2013 to 2015 listed in columns G, J and M
- Go to https://www.elsevier.com/solutions/scopus/features/metrics and click on the <Show more> button to access and download an archive of SNIP values dating back to 1999.
- Go to the CWTS “journal indicators’ page: http://www.journalindicators.com/
You can learn more about <Browse sources>, <Analyze search results> and <Compare journals> in this recent webcast:


