Scopus interface improvements released Saturday, September 6
Since launching a more streamlined interface in February, the Scopus Team has been working on additional site developments that include enhancing Scopus analysis tools as well as improving ORCID functionality.
Taking a close look at the Scopus analysis tools, the team made some changes that better support day-to-day research tasks. As a result all analysis tools have been redesigned to provide a more consistent experience across Scopus. Specifically, these 3 tools have been improved and renamed and now include new features such as the option to export charts and graphs.
Old Scopus name | New Scopus name | Location on Scopus |
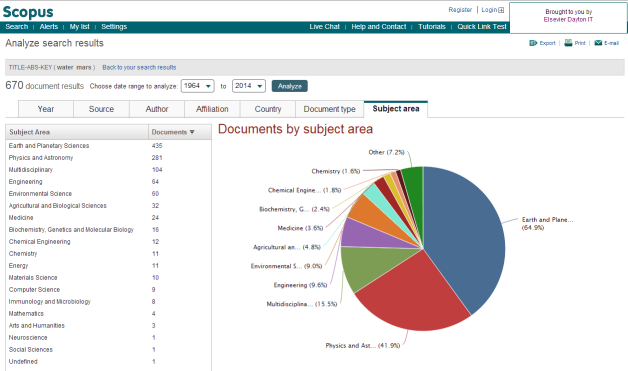
Analyze Results | Analyze Search Results | Document Search Result page |
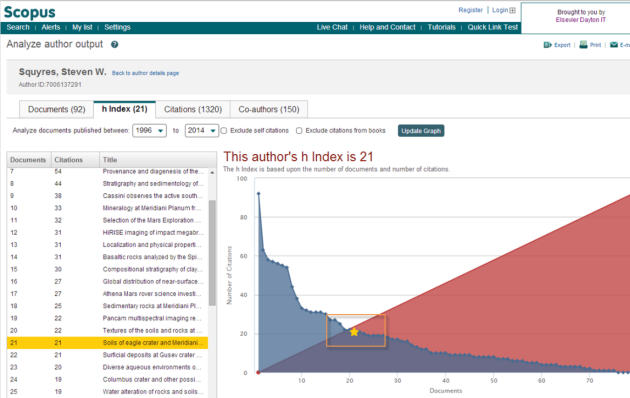
Author Evaluator | Analyze Author Output | Author Details page |
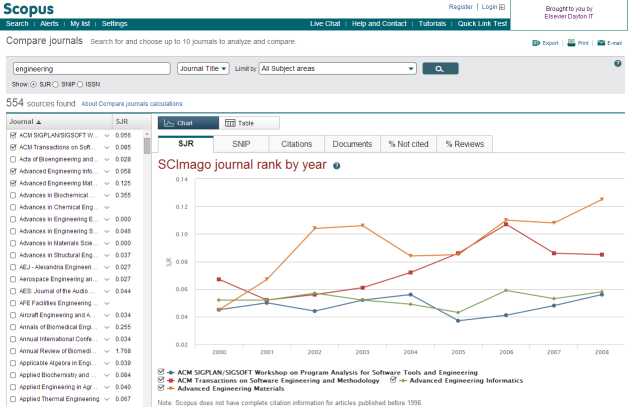
Analyze Journals | Compare Journals | Main search page |
New Analyze Search Results illustrating documents by subject area:
New Analyze Author Output with enhanced h-index indicator:
New Compare Journals:
Along with this release, all Scopus analysis tools have been moved to JavaScript technology and no longer depend on Flash support in browsers. With this development, Apple iOS device users are now able to access the analysis tools as well. In addition, all users are now encouraged to take advantage of a new image export option that lets you save charts and graphs in a zip file. The .zip file is able to house .jpg, .pdf, .png and .svg formats.
It is also now possible to search Scopus Author Profiles by ORCID ID. If a user knows the ORCID ID for an author they can retrieve that authors profile in Scopus. In addition to the Simplified Chinese interface announced in June a new Traditional Chinese interface went live this month. Both are available from the Scopus page footer under the header ‘Language’. For a detailed review of the changes, please read the full release notes (PDF).
We welcome you to experience the Scopus difference today and discover how easy it is to track, analyze and visualize research. For help getting started, watch this short video on making the most of the Scopus ‘Help’ function. Thank you for playing a part in the recent and long term success of Scopus and we encourage you to continue to follow us on Twitter .
You can share your feedback by emailing Scopus Marketing.


